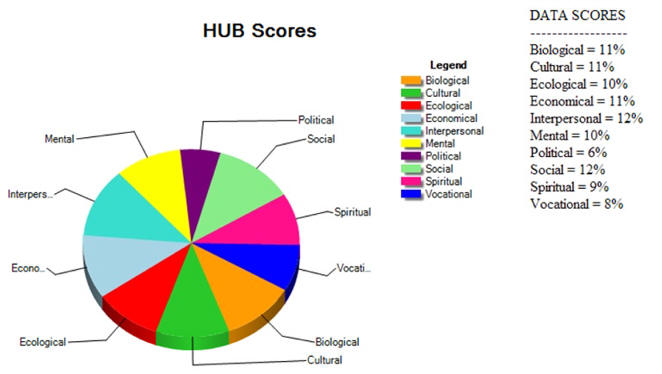
Upon completion of the questions in each dimension, the numerical data will be compiled and analyzed. The results may be displayed in pie shaped graphs or other forms of analysis.
Graphs may be color coded to highlight each dimension. Example the color, blue may highlight Dimensions of Person/Family and the color yellow may highlight Dimensions of Environment. Any color of choice can represent any dimension, just as long as it remains consistent.
This questionnaire will take about 20 minutes to complete. At the end of the questionnaire, a pie chart will display your results, along with a breakdown of your strengths and weaknesses in each subject. For best results, do not exit the questionnaire until you have completed all of the questions.
 Instant
Additional link will be provided for follow up counseling and recommendations online.
May be used for a person, or modified for a group or community. For evidence based outcomes, assessment, planning, intervention (health promotion prevention, protection and evaluation.